
 Blog Software Development How to jump into another level in manual testing? 5 tools which allow you to make a huge step
How to jump into another level in manual testing? 5 tools which allow you to make a huge step
When you take your first steps in manual testing and become immersed in the world of software tests, you often rely on testing the functionalities. You focus on analyzing the app literally from A to Z, reporting any encountered problem: from typos, to the obstacles to using the app, to data loss. A question arises – in what way can manual testing be improved?

Table of contents
One of the ways to make manual testing easier is adding some tools to support you in this process. There are many solutions which can help you enhance the quality of your software in all aspects, but you need to remember that they are only tools – and like all tools, they have their drawbacks. Any report, data, or potential error detection in the app performed by the tools discussed here should be verified by the tester afterwards – you are at the helm of this boat.
In this article, we’re going to talk about the following tools:
- Lighthouse
- SecApps
- GTMetrix
- Htbridge
- aXe accessibility
Lighthouse
This tool lets you run an automatic audit of the app, checking its performance, progressive web apps, accessibility, SEO, and the best practices which can give you better results than those obtained with other methods. Lighthouse is available in three versions: a Chrome extension, an integral element of Chrome DevTools, and a Node module – you can also run an audit from the command line.
How to run this tool in the easiest possible way? Using the homepage of the app you’re going to verify: open the developer tools and select the Audits tab.

Next, create the desired configuration (it’s a good idea to take a look at all the options in the Throttling category).
Having selected the best option for you, click Run audits. An automatic app scan will start. The next stage is the analysis of the report you receive after the scanning is complete.

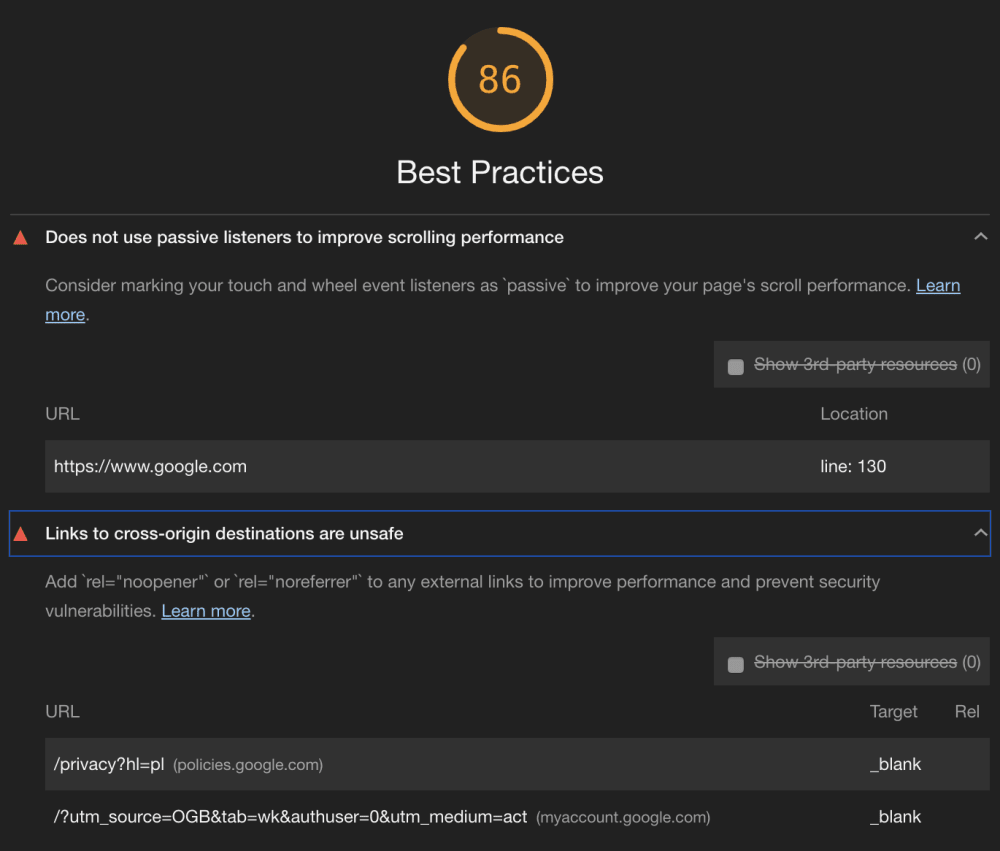
The picture above presents the report results for google.com.
The report shows the percentage for each index and detailed data for each analyzed category. The details include references to the particular components which have not met the requirements of the audit as well as information about how to fix the errors which have occurred along with the explanation why this specific aspect should be fixed.
What is the value of this report for a manual tester? You can find a whole range of potential errors: from slow performance on the simulated 3G network to wrong configuration of the robots.txt file. The latter may end up in the app being absent from Google search indexing. Beginning manual testers often pay little attention to this kind of issues: by detecting them, you can considerably upgrade the quality of the software you work on.
SecApps
This is a Chrome extension as well as a separate website which functions as a scanner. It has a free version, whereas the paid package contains extended functionalities. Thanks to SecApps, you can analyze a website against possible security errors. It’s very easy to use – you just need to insert the chosen URL in the text box above the Lock target button, then block the URL by means of the Lock target button, and then click Start.
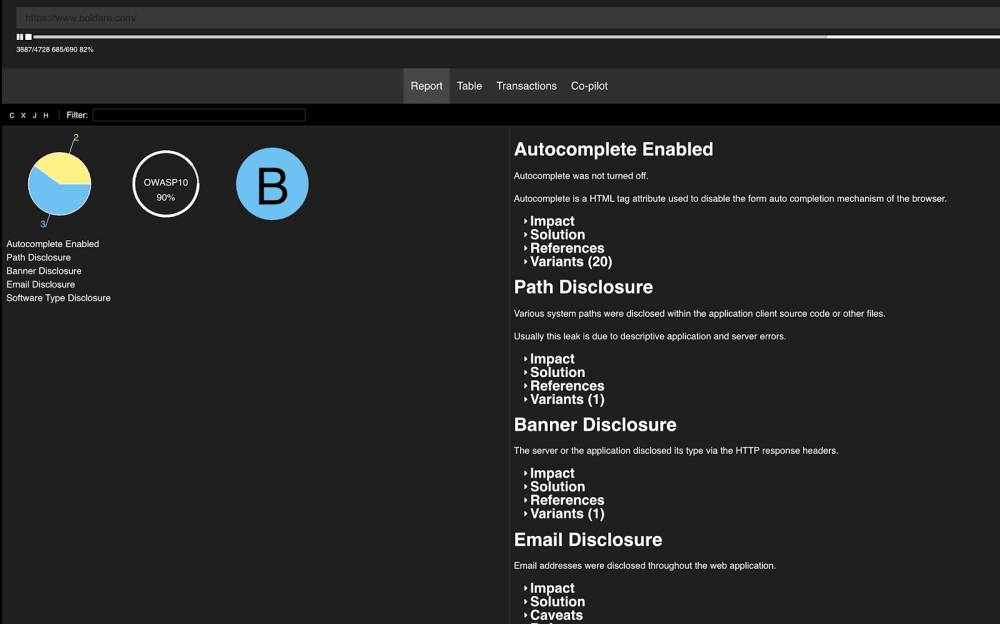
Like in the case of Lighthouse, you will receive a report presenting the results and potential security threats for the analyzed app. As I’ve mentioned before, tools are generally imperfect and tend to be wrong; but since you’re the operator of the tool, you get the final say on the matter and decide whether something actually is a problem or not.
Below, you can see an example of a mistake made by the tool: the problem indicated is just a simple piece of information, not an issue in your app. What’s the problem with this “problem”?

The picture above shows the name of the server returned by one of the HTTP headers – server: Netlify. This is not an error: the information about the server’s name is widely available for most applications. We would be talking about an error if the version was disclosed along with the name. That’s why you must always remember not to put your total trust in the tool you use and make sure whether the data it provides comply with the facts.

GTMetrix
GTMetrix measures the performance of your site and returns the analyzed data in the report form. It is available on a separate website, where you insert the URL of the application to be analyzed and then scan it.

The report generated by the tool presents the data about the areas which can be improved with regard to the app’s performance as well as information about the general evaluation concerning PageSpeed and YSlow. PageSpeed index has been created by Google, while YSlow is its counterpart created for Firefox. The total result consists of all the rules dedicated to each score. If you want to learn more details, you just have to click the given rule.
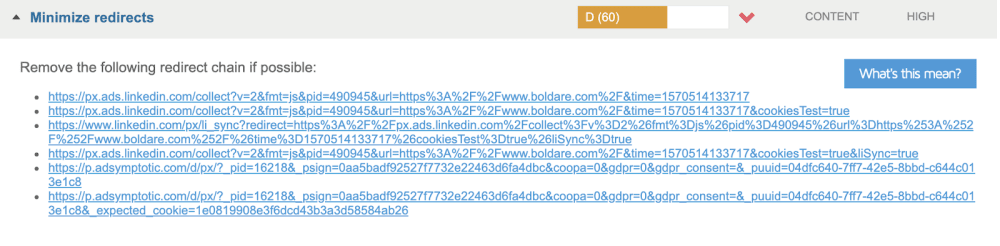
Then, you receive information about what elements can be improved (in this case: link redirects). You can also use the documentation by clicking What’s this mean?
Htbridge
This tool is similar to SecApps: it helps you find potential security loopholes in the safety settings of your app or website. It offers paid subscription as well as free scanning options. The free version enables you to scan web and mobile apps, check the SSL, and run a test against a phishing attack. How can you improve your manual testing using this tool? In this post, I’m going to analyze the SSL scanning option. To test it, you simply need to click Free Security Tests in the navigation bar, and then select the SSL Security Test option. Enter the domain name in the blank field, e.g. https://www.boldare.com.

Important: you must remember about one crucial thing – if you want to scan a development environment, always check the Hide from the Latest Tests option; otherwise, your website will show up in the Recent Web Servers Security Tests list and I don’t think you want everyone using this tool to peek at an app in the development stage.
When you’re ready, click Play. When the scan is over, like in the previous tools, you will get an overall report with summary results.

For a person with little experience, the key information to make use of here is the certificates’ deadlines. Make sure you inform the adequate team about the certificates’ expiry dates. Don’t wait until this is done by the machine – they are not reliable enough.
aXe accessibility
The last tool discussed here is a checker which makes it possible for manual testers to verify the app’s accessibility. Accessibility as such is an extensive area to be tested, however frequently ignored and omitted. Unfortunately, this proves to be a common problem affecting websites. The tool is available as a Chrome extension, used as a separate tab in the DevTools.

Run it by clicking Analyze, and you will receive the report in the same tab in no time.

One of the most frequent application issues encountered as a result of manual testing in this respect is the lack of descriptiveness in the names of website components. This brings on numerous problems for the disabled persons who use the site, helped by various screen readers. Besides, you can come across a message about the lack of optimal contrast, which causes the user’s fatigue in the use of the app.
Thanks to this tool, you can check the accessibility features of the tested app.
Testing tools - a summary
Clearly, I could spend much more time and words speaking about all these tools, but this was not the purpose of this article. Its goal was to present the opportunities offered to manual testers and the methods which they can employ to support their functional tests.
There are plenty of all sorts of tools available on the market, each of them analyzing a different aspect. In this text, I wanted to show you those which aid me in my everyday work and support the software development life cycle stage called maintenance. I don’t want to write long passages about each single error which can be detected by those tools – this is up to you. What I can guarantee, though, it that you won’t be disappointed if you add them to your daily project tasks. This way, you will contribute to the creation of top-quality apps, user-friendly for people both with and without disabilities.
When you start making use of this type of tools, you may be surprised with the results you get. Their fluctuation will look strange to you: you’re likely to get totally opposite scores, from 10% to 90%, frustratingly enough. What is certain, however, is that by analyzing such reports and introducing the necessary improvements, you’re going to enhance your technical skills. Now’s the time to ask the difficult question: how to persuade your team that this makes sense? The best idea is to stop persuading them: simply show them the potential benefits of improving the performance and optimizing various elements of the app you work on together. To do this, you can use a great source: https://wpostats.com/ – this site collects data about the businesses which decided to improve and optimize performance and the benefits they reaped thanks to that.
The first interaction with the user is what matters most so if there are problems with loading your website in the 3G or 4G network, it’s quite possible that the user will stop using your app right away. Also, if the user doesn’t get at least an outline of the content in the first couple of seconds, they’re likely to become disinterested. These are mere details when compared to other elements of the software provided by you, but the details pretty often determine the ultimate quality of the product.
Share this article: