How to improve team efficiency using the burndown chart metric - a case story
The burndown chart is one of the most popular metrics used by most Scrum teams working on digital products. It shows how much work needs to be done, and how much time is left until the end of the sprint. For product owners, it’s one of the main efficiency measures. For scrum masters, it can be treated as a health indicator that shows how well the team understands the product and prioritizes the sprint backlog. Today we will tell the story of how we improved our Scrum process, using a burndown chart as a health indicator.

Table of contents
The client and product
Our client is a government-owned agency from the Kingdom of Saudi Arabia that helps private companies looking for new employees to sign contracts with HR agencies. Boldare has been responsible for the product from its very beginning. The app is in its product-market fit phase.

The challenge
The team faced some challenges when a new product owner took over the project, covering for the original PO (Product Owner). While this kind of change happens often, the new PO was relatively new to the Scrum framework. Soon we experienced some communication and process issues due to the new situation:
- the team didn’t receive feedback from the Product Owner as quickly as it needed,
- the PO was hard to reach,
- tasks were reviewed at the end of each two-week sprint, so the team had to put in extra effort at the end of the sprint to adjust tasks according to feedback,
- during the planning and refinement phase, tasks were insufficiently described, and it took extra time to understand them sufficiently,
- the stories in the sprint were too complex, and it took a lot of time to properly understand them,
- the team had to invest additional time in the discovery process to understand the goals better.
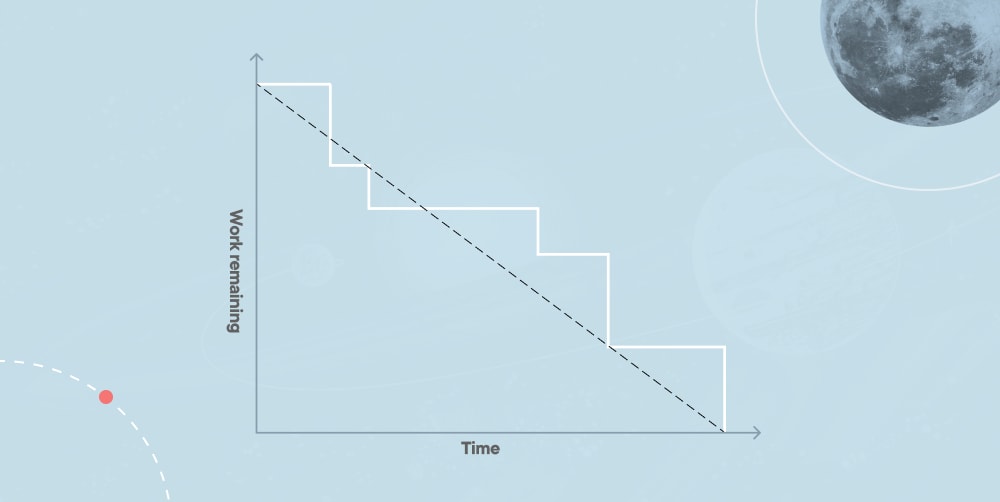
All of the above resulted in a visible slowdown of the development process. One of the manifestations of such a situation is a cliff in the burndown chart. It happens when most of the tasks are marked as done during the very last day(s) of the sprint. It looks like this in chart form:

While the ideal burndown chart in Scrum should look more like that:
Fortunately, the team (back and frontend developers, QA engineer, product designers and a scrum master) was experienced enough to provide the necessary feedback and support.
The solution
The team decided to react. The first step was to provide valuable and honest feedback to the product owner. The team forwarded the feedback to the PO, pointing out that:
- the backlog and stories were lacking crucial information,
- there was no acceptance criteria assigned to the stories and tasks,
- the team lacked clear expectations and understanding of why a particular story has to be done,
- tasks lacked use cases that would help to understand the intentions behind tasks.
The team, including the scrum master, suggested the Product Owner adopt a couple of improvements that could help to solve the above mentioned issues:
- start the planning process earlier, and put more effort into describing the stories with more detail,
- understand how the estimation process works,
- discuss more about the value that stakeholders want to bring to the users.
The Product Owner responded positively to the recommendations we gave and started to prepare a backlog earlier. We have introduced an important policy: each day the entire team, including the PO, estimated one user story, so we could divide it into smaller tasks in the backlog. Planning began to be quicker, so the team could spend more time on new iterations.
Thanks to this approach, we started delivering smaller tasks that were deployable and gave better value to the users more quickly. Smaller tasks are also easier to check for a product owner, so the team was able to receive feedback before the end of the sprint. That way, we were able to improve our work much faster and provide progress for both stakeholders and users.

Developers take ownership
We also improved the collaboration between developers and QAs. In a team with five developers, a single QA becomes a bottleneck. That’s why the team decided that the developer should be responsible for the task throughout the entire testing process. Then, when the QA deals with a couple of bugs, the developer responsible for the tasks helps to solve the issue, before moving on to completely new tasks. This way, developers can effectively improve the process and make the work of the team easier.
Burndown chart- a whistle-blower for the Scrum team
The burndown chart is an excellent way to visualize how far along you are in completing tasks. It can signal many things, but as this story shows it’s just one piece of the puzzle without proper communication between product owners/product managers and Scrum teams!
Share this article: